Thursday, May 17, 2018

Gearing Up for NC Exams

Recently, I have been collaborating with teachers on creating "practice" exams. We've developed a NC Math 1 Practice EOC and a NC Final Exam for Math 2.

I'm sharing here in case they can be beneficial for others.

I prefer to start with a blueprint design when creating assessments so I'm also sharing these with you. They should provide some additional information about the practice exams.
Math 2 Design

Finally, I tweeted these out last semester and thought I should include them here as well. I compiled resources for review in NC Math 2 and NC Math 3. I organized them in a Google Sheet so I can continually add to and update.
**NC Math 2 Review Resources: http://bit.ly/Math2Rvw
**NC Math 3 Review Resources: http://bit.ly/Math3Rvw

As always, I appreciate any feedback as it is how we learn and grow. Best of luck to you and your students!!

Friday, April 20, 2018

Presenting at #NCTMannual 2018

I was thrilled when I received the acceptance letter to present at the 2018 NCTM Annual Conference in Washington, DC. My presentation is titled

Algebraic Procedures in Need of a Conceptual Makeover

and I will presenting on Friday, April 27 from 8:00 - 9:00 in the Walter Washington Convention Center room 147B.

So, what does that title mean? It's a response to lessons that present a procedure to students followed by pages upon pages of practice problems. These lessons exist. I know. I've seen them. I'm even guilty of having taught a few of them. They usually begin with notes and, if the teacher is really creative, the notes take the form of a foldable. (Don't get me wrong. I love foldables. I just prefer that they summarize student learning rather than present the learning to them.) Anyway... this presentation is my attempt to discuss how we can "effectively build fluency with procedures on a foundation of conceptual understanding" (Principles to Actions, p. 10).

This topic has been rolling around in my thoughts for some time. Here's how I see it:

I am fascinated by how students learn which is different from thinking about what they learn. The highlight of my job is when I can be in a classroom and listen to students.  Listen as they talk about math, ask questions, make mistakes and corrections. This is what happens within the middle part. I want to capture and share the informal reasoning strategies students use to make sense of procedures before they even know they are procedures. The middle part is the focus of my presentation.

I am using three procedures to illustrate this idea.

  • Writing the equation of a line given two points
  • Identifying the vertex of a quadratic given vertex form, and
  • Solving exponential equations using logarithms.

Here is the presentation and the handout.

Since there is a possibility that I won't get to all three examples I've made videos to complement the presentation. This first one is writing the equation of a line given two points.


The second is solving exponential equations using logarithms.


So, that's it. I've prepared what I want to share. Handouts are copied and uploaded. I've practiced (and will continue to practice). My bags are packed. DC bound.

Thanks for coming, for reading/listening, and hopefully I'll meet some of you in DC.


Friday, November 17, 2017

Understanding Standard Deviation

Long story short, I was presented an opportunity to teach standard deviation and I jumped at the chance. There are times as a coach that I wish I were back in the classroom. I do miss working with students daily. Anyway, here's what I did.

Launch:
To start, I wanted students to think about the center of a data set. I asked them to individually consider each of the following and provide a typical number that best represents the situation.
I intentionally avoided using the words average, mean or center. Sometimes when I use a "mathy" word students hesitate. I'm not sure why, but I have my theories. I know I get better responses when I use the word typical so I went with that.

As we discussed each one, I wanted to draw out some important characteristics: Minimum value? Maximum value? and Are the possible values close in range or spread out?
I used the first situation as a contrast to the others to bring out variability. There are 24 hours in a day and this doesn't vary given you are talking about a day on Earth. The other situations have some variation in the data. That's what we are talking about today: variation in a set of data.

Going to the Movies
The Justice League movie is releasing next week and we are very excited about getting to see the movie. Imagine you are in the theater and settling in to watch the movie. There are people all around you and you begin to wonder...
  • How old are they?
  • Are they all the same age? If not, what is the typical age?
  • How close are the other ages to that typical age?
Here's what we got from that question.
The typical age is 26 years old with many people between the ages of 16 and 36. (Okay, I had to prompt them to think beyond the age of 30. At first it was 5 yrs old to 30 years old.)

Okay, so I've got them thinking about measure of center and variability. They've even put some values to that variability. Now, let's collect some real data.

Estimating Time
So here's why I wanted to teach this lesson. I really, really, really enjoy playing with this site and like how its simplicity captures students' attention.

Ever waited to go on vacation and it seems like time slows down but when you are on vacation the time goes by quickly? While the passing of time is constant, our estimation of how much time has passed varies. I wonder how close are we at estimating 10 seconds? Let's find out.

Each student was asked to estimate 10 seconds and record the amount of time to the nearest tenth on a sticky note. (Because this is a small school, I collected data earlier that morning from a variety of teachers and students. This allowed us to have enough data to analyze.) We built a histogram from the data. Great opportunity to assess student understanding of values within each interval.


The conversation started broad by asking what they noticed about the data and if it helped to answer our question about how close we are at estimating 10 seconds. I directed the conversation towards getting closer to standard deviation (without saying standard deviation, yet).
The students were developing a good sense of center and the values in relation to the center. Students talked about the estimates being 1.5 seconds less than 10 and 1.5 seconds more than 10.

This 1.5 you are using to describe how far away the values are from the center was a number mathematicians wanted to calculate. It's not the full range of the data but a value that can tell us how far some of the data is from the center. This number is called the "standard deviation".

Illustrative Math Task
Students were given the Illustrative Math Task Understanding the Standard Deviation. I used Part 3 as the formative assessment to gauge student understanding.

Up Next
The next lesson is to calculate the standard deviation and work on interpreting it. I like the EngageNY lesson Algebra 1 Module 2 Lesson 6 Interpreting the Standard Deviation.

In case you were wondering, because, let's face it, I was wondering, how close were the estimates for mean and standard deviation? The mean was 10.4 seconds and the standard deviation was 1.9 seconds.


Monday, November 6, 2017

Reflections on NCCTM17

The North Carolina Council of Teachers of Mathematics has their annual Leadership and Math Conferences this past week.It was a whirlwind three days with fabulous speakers including Jennifer Bay-Williams, Peg Smith, Juli Dixon, William McCallum, Joliegh Honey, Jennifer Wilson, ....  The list goes on. Anyway, I always enjoy the conference and wanted to share a few highlights.

First, I had the privilege to present with one of my teachers, Kim Clark. We presented Factoring Using the Area Model. It is very rewarding to work with a teacher who pushes you to grow because she wants to be better. I have learned a lot from her over the years and was thrilled to get to present this session with her.

This is a slide from our presentation. Did you know that the diagonals of the area model have the same product? Using that fact, we asked participants to find the possible area models. This question is the lynch pin of the investigation we did with students to help them develop a strategy for factoring when a is not 1. It's pretty cool and effective.

Second highlight was hearing Jennifer Bay-Williams talk about Becoming Fluent in Developing Procedural Fluency. This is an area of growth and learning for me. I am an avid supporter and believer that conceptual understanding is critical to students understanding and making sense of mathematics. What I am learning is that it takes specific and intentional instruction to help students develop that understanding into procedural fluency. I am also learning how to better define fluency as more than just quick.

The last highlight I'd like to share was the session from Dr. Valerie Faulkner on Opportunity, Equity & Agency: How do our grouping practices mediate student sense of mathematical identity? She makes a very convincing argument about how grouping in education (high and low students) just doesn't make a lot of sense. The statement I have been using to summarize her talk is one she made.

"We are surprisingly bad at evaluating what a person can and will do even if we have a vested interest in doing so." 

We should stop trying to separate students using some abstract high and low characteristic of student ability. We must begin to talk about students in regards to what they know and when they need to work on.

As I shared, the three days were a whirlwind. I am excited about new friendships developed and being able to connect with teachers from across the state. Maybe I'll even start blogging more often. Haaaa.....Haaaaa.....Haaaa. No promises but always a goal.

Wednesday, September 28, 2016

Floating Down the River

In an effort to support teachers across the state with the implementation of the revised NC Math 1, 2, and 3 standards, the K-12 Mathematics team are hosting weekly webinars. Each Thursday focuses on a different course: Math 1, Math 2, Math 3, and Math Leaders. Find out more here.

The sessions present a math task (if you register early you will get it in advance) and frames the discussion on standards, implementation, anticipating student misconceptions, and connections.

This past month I was able to participate in the Math 1 and Math 2 sessions. The Math 1 session was on Functions and we were given the Floating Down the River task. (Which I tweaked a little. You can find the original version here.) I really like this problem especially to discuss the key features of the functions and interpreting them in context.

This is one of my SOAP BOX concerns: the difference between F-IF.4 and F-IF.7. When we discuss functions it quickly becomes about the "families of functions." You know the ones I am talking about - linear, quadratic, exponential, etc.). With these functions we are able to use the symbolic representation and determine key features. For example, rewrite a quadratic into vertex form and identify the vertex. This is F-IF.7.

So what is F.IF.4? It doesn't seem like it should be the same thing. IMHO - it is not. While F-IF.7 focuses on those classical function families, F-IF.4 is broader. It includes all functions. This includes functions I refer to as functions that tell a story. These functions may be represented symbolically, often by a piecewise function, which is well beyond the focus of Math 1. However, it is not unreasonable for students to reason with and interpret the key features using a table or a graph.

That's why I like the Floating Down the River task. Students are given multiple tables of values and a simple question is posed. I would expect students to do what we did during the session and graph the values. (Further commentary could be given on whether depth is positive or negative but I'll leave that up to you to decide.) Now, there are opportunities for students to discuss intervals of increase/decrease, maximum/minimums, average rate of change, and intercepts. They also have to compare and connect the events. Such as, when the water is shallow the speed increases. Can students also recognize that the distance function becomes steeper? Will they recognize why that would be occur?

There is great potential in the task which is why I am encouraging my teachers and sharing with you. Try it and see what students do with it. I guarantee learning will take place. Also, consider joining me and others at the next Math 1 webinar.

Friday, August 26, 2016

Starting a New School Year!!!

The 2016-2017 school year begins next week and we are busy getting ready. North Carolina revised the standards for Math 1, 2 and 3 so the past few weeks have been focused on getting the curriculum materials aligned. Math 1 has some changes but Math 2 and 3 had a lot.

I've been getting requests for our pacing guides and outcomes. They have been updated on the respective pages (Math 1 and Math 2).

For Math 3, a major concern is to make sure students do not experience gaps in concepts due to the movement of some standards out of Math 3 and into Math 2. For example, complex solutions to quadratic equations is now in Math 2. This year is a transition year in Math 3 and won't look the same as last year or next year. Therefore, we are not revising anything as much as we are "tweaking" some things. If you have questions about Math 3 please contact me and I'll share what we are doing. If there is enough interest I may post it here.

Okay, time to get started with the new year!!! Thanks for checking in.

Thursday, May 19, 2016

NCFE Review Solutions

There have been multiple requests for answer keys for the NCFE review sets. Well, I have finally had some time to sit and work on them. I have posted the solution sets for Math 2 and Math 3 right now. My goal is to work on Math 1 in the next few days and also get it posted. Yeah!! Math 1 is also done!

***Warning***
There may be mistakes. Actually, I would be surprised if there weren't any mistakes. So, if you find one (or two or three or....), please let me know.

Mistake #1
Math 1: Review 4: Problem 2 -- the area of the triangle should be 13 unit squares not 26.

Saturday, May 14, 2016

Math 1 EOC Review Materials

Your students have spent all semester or possibly all year studying the Math 1 standards. Now they must take the Math 1 EOC. In an effort to provide review material for teachers, my colleague and I put together some resources.

We designed the resources around the conceptual categories: Number & Quantity, Algebra, Functions, Geometry, and Statistics. We also did a Linear & Exponential folder. In each folder you will find Resource Description. In this document we have listed the resources along with the alignment to the standards, type of resource, recommendation about calculator use, and some instructional suggestions. Our intent was to provide some variety for review along with opportunities for class discussion and strategies for solving problems.

There are two other folders. One is General Resources which provides information about the specifics of the Math 1 EOC. The other is Comprehensive Resources. This folder has some calculator inactive tasks, midterms we have used in our district, the released EOC and the mini quiz review sheets.

I hope you find some of this beneficial and I wish your students the very best on the exam.

Here is the link to the entire Math 1 EOC Review Resources. I will also post on the Math 1 page.

Tuesday, March 1, 2016

Updates

Contact Information
Wow!!! The traffic to this website has exploded overnight. More and more people are visiting every day. To help in communication, I have placed a contact form on the left hand side. This will allow you to email me directly with comments or requests.

EOC and NCFE Reviews
Several of you have requested answer keys to the review resources. I'm not ignoring your request. I just don't have them. However, I am working on them. I hope to have them posted and revised before the testing in May/June.

Curriculum Maps
These are coming. I added two more in Math 1 today and should add more to Math 2 soon. As the maps are added so are the resources noted in the maps.

Thursday, February 18, 2016

PtA Series #2: Implement Tasks the Promote Reasoning and Problem Solving

Let's begin this discussion with a question. What is a task? I once asked a teacher what task students were going to do in class that day. The response was "No task. They are just going to complete a worksheet and then start on an investigation." Hmmmm..... aren't those tasks? My guess is that for some teachers a task is a rich math problem that stretches your mind. Like the one below:

For me a task is any activity given to students to do. That includes worksheets, quizzes, writings, discussions, etc. Suffice it to say -- tasks come in all shapes and sizes. That may be a little cliche but the emphasis is important. Teachers chose every day what tasks to give students.  This choice is extremely important and one that bears deeper discussion.

"Effective mathematics teaching uses tasks as one way to motivate student learning and help build new mathematical knowledge through problem solving." (p.17)

What should a teacher consider when choosing a task? The decision is about the opportunities afforded students to make sense of problems and explore solution methods connected to the established goal of the lesson. (see practice 1) So what do I think about the task we used in the Leaping Lizard Lesson?

Using the taxonomy designed by Stein and Smith, I think that the Leaping Lizard task falls within the category of a higher-level demand. Students are encouraged "to engage in active inquiry and exploration" (PtA p. 19) I lean more towards procedures with connections as suggestions are provided to students for ways to look at the transformations (i.e. connect image and pre-image points). However, students are required to expend some cognitive effort to develop a deeper understanding of the definitions of the transformations.

While selection of the task is important so is its implementation. In an effort to help students that are struggling, a teacher can inadvertently GPS the task by "taking over the thinking" for students. This lowers the demand and effectiveness of the task. I've witnessed this happening with the Leaping Lizards task. The teacher told students upfront what they would discover and consequently students were no longer invested in doing the task. A teacher has to mindful to "support students without taking over their thinking" (p.24).

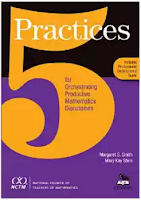
Knowing not to GPS and not doing it are two different things. It takes practice and intentional planning to change and prevent oneself from falling into that habit. I recommend the book 5 Practices for Orchestrating Productive Mathematics Discussions by Margaret Smith and Mary Kay Stein. A number of years ago I was introduced to this book during a lesson study. It has been my guide ever since in implementing tasks in the classroom. We will revisit this again in part 4 of this series when we talk about student discourse.
Next time, the practice is use and connect mathematical representations and I will share one of my favorite tools when studying functions.

Monday, August 24, 2015

New Resources for 2015-2016

I am so excited to start the new school year. I spent June working with a great group of teachers writing and preparing the Curriculum Maps. You can find these on the resource pages for Math 1, Math 2, and Math 3. These have been a goal of mine for a few years and finally we have them.

July was all about family. We took a road trip to Canada and spent a week by the lake. The Northern Pike are aggressive and a lot of fun to catch. I was super excited to catch a Lake Trout.

August has me back at work where I continue as a high school math coach. My school assignments have changed a little so I have new relationships to build. There have also been a lot of turnover so there are several new teachers to get to know.

I have posted new resources on the Math 1, 2, and 3 pages. Make sure you check them out. I used feedback from teachers and have revamped some of the investigations. You will also find some new resources inspired by NCSM and NCTM conferences I attended in Boston.

Stay tuned for the return of the series on the Principles to Actions, a post about Conversation with a Wrestling Coach, and the upcoming NCCTM conference.

Sunday, April 12, 2015

PtA Series #1: Establish goals to focus learning

I've been interested in the Principles to Actions publication by NCTM since it came out a year ago; however, I haven't found the time to read it. So, how do you accomplish something you want to do? You set a goal. My goal is to read the Principles to Actions (PtA) book and I'm holding myself accountable by making a commitment to document my learning here through illustrations and reflections.

NCTM has a website specifically dedicated to PtA (check it out here). I watched the video of the presentation by Dr. DeAnn Huinker at last year's NCTM Annual Conference in New Orleans. She describes and illustrates the 8 Mathematical Teaching Practices.

At the beginning of the presentation, she asks "What is the best math lesson you ever taught?" The Leaping Lizard! lesson came to mind and I thought it would be a worthwhile activity to reflect on that lesson within the framework of the 8 Mathematical Teaching Practices.

One of my favorite things about coaching is working with teachers to develop lessons and teach. The Leaping Lizard! lesson is a collaboration between myself and another teacher. I will use this lesson to think about the 8 Mathematical Teaching Practices. Let's look at #1.
1. Establish mathematics goals to focus learning. In full disclosure, we didn't start here. We actually chose the task first; but in thinking about what we wanted students to learn from doing the task, we needed to talk about the goal. So, we may not have started here, but we did get here quickly. The standards we were addressing were 

G-CO.2 Represent transformations in the plane using, e.g., transparencies and geometry software; describe transformations as functions that take points in the plane as inputs and give other points as outputs. Compare transformations that preserve distance and angle to those that do not (e.g., translation versus horizontal stretch). 

G-CO.4 Develop definitions of rotations, reflections, and translations in terms of angles, circles, perpendicular lines, parallel lines, and line segments.

We wondered what students may already know about transformations. In 8th grade, students verify the properties of the transformations (8.G.1). They also describe a sequence that exhibits a transformation (8.G.2). We anticipated students would be able to recognize the transformations and use general descriptions such as flip, turn, or slide to define them. Our goal was for students to use lines, angles, and circles to verify a transformation. We also wanted students to represent a given transformation (a skill we would continue to work on for the next few lessons).


How does this measure with the actions outlined on p. 16?
  • The goals are clear and articulate the mathematics that students are learning. We knew we wanted students to take the transformations beyond just a simple movement. We wanted them to understand the relationship between the image and preimage points.
  • The goals fit within the learning progression. This was the first lesson in the unit. We had to build upon the 8th grade standards.
  • The goals were explicitly stated throughout the lesson to focus student work. During the lesson, we had to emphasize the goal multiple times. This helped to clarify with students how we expected their understanding of transformations to extend beyond the movement. Students were to explore the properties and develop definitions.
  • The goals guided the planning and decisions made during instruction. This task could be used to accomplish a variety of goals. It was critical that we have a clear understanding of student learning.
There are a number of challenges with this practice. First and foremost is time. Teachers need time to research the vertical alignment of the standard and time to discuss and refine goal. In our district this means leveraging the PLC time to focus on goals of lessons. There is also a need for quality tasks. That is Practice #2 which I will address in the next entry in this series.

Tuesday, January 6, 2015

Review Material for NC Testing

Happy New Year!!!

The end of the semester is upon us. Teachers and students are preparing for final exams. In North Carolina there is the End of Course exam for Math 1. This test is used to evaluate schools and teachers. It is one of the measures used by the state to determine the "grade" on the school report card. There are also NC Final Exams for Math 2, Math 3, Discrete, Advanced Functions and Modeling, and Pre-Calculus. These are used to measure teacher effectiveness.

Although I am tempted to rant about the fact that a high school is "graded" on a math test that only a portion of 9th graders take. (Advance students take Math 1 in the 8th grade.) I will withhold my opinion on the evaluation system and get to sharing resources.

My opinion is that it is best practice to spiral review. This means students are presented with problems throughout the semester that require them to continually access the concepts previously studied. Common practice is to take the last few days before exams and work through problems.

Both practices require a set of problems to present students. Today I am sharing review material.
UPDATE: Solution sets have been posted on each course page as well as on this post
As with all resources I post, it is possible there are mistakes. If you find any, I would appreciate it if you would let me know. Just leave a quick note here.

Wednesday, December 17, 2014

Advocating for the Common Core

I support the Common Core. In 2010, when I was first introduced to the standards, the geek in me was excited about diving in, making sense of what they said, and creating learning opportunities for students. I embraced the change because the new standards are better than what we had.

Here's a comparison.

Previously, students were to use linear functions and now they are expected to create linear equations. The change in verbs is a critical transition from the old standards to the new standards. The expectation of what students are to know and be able to do increased. When I noticed this difference in the expectations I began to seek a better understanding of the standards and what I really needed to get my students to do.

In 2012, I became a math coach and a large part of my job is supporting teachers to implement the new standards. One standard in particular is
G-GPE.6 Find the point on a directed line segment between two given points that partitions the segment in a given ratio.

What? I didn't know how to do this much less teach students how to do this. Thus, I began my journey into learning about partitioning. Did you know that students in elementary grade partition? Yep - it's true.
  • 1st grade: Partition circles and rectangles into equal shares.
  • 2nd grade: Partition a rectangle into rows and columns of same size squares.
  • 2nd grade: Partition circles and rectangles into two, three, or four equal shares and describe the shares.
  • 3rd grade: Interpret whole-number quotients of whole numbers (56/8 is 56 objects partitioned into 8 equal shares)
  • 3rd grade: Understand a fraction 1/b as a quantity formed by 1 part when a whole is partitioned into b equal parts
  • 3rd grade: Represent a fraction 1/b on a number line diagram by defining the interval from 0 to 1 as the whole and partitioning it into b equal parts.
  • 3rd grade: Partition shapes into parts with equal areas.
  • 5th grade: Interpret the product (a/b) x q as a parts of partition of q into b equal parts.
Now, in high school Math 2, students must partition a directed line segment.

I looked for resources and found examples of how (procedural understanding). I found a few examples of why (conceptual understanding) but they came from the approach of vectors (not a prior understanding for Math 2 students). I didn't find anything that built upon the previous standards (coherence). So, what did I do? I wrote an investigation which can be found here

This is the stuff I love - learning, creating, making sense of the things. The new standards have challenged me to think and that is a good thing. The new standards have prompted me to learn about how students are thinking about and doing mathematics in grades K-8. The new standards have introduced me to new concepts.

I am an advocate for the CCSS because of what it offers teachers and students - a focused, coherent, and rigorous mathematics education.

Wednesday, October 29, 2014

44th Annual NCCTM Conference

I am excited about this year's NCCTM State Math Conference. It is a great time to talk with others who are as interested (and yes, passionate) about teaching and learning mathematics. This year's theme is Big Ideas for Teaching and Learning Mathematics.

Each year I try to share one workshop that examines a specific content area and one session that looks at a teaching practice.

This year's content workshop is "Transforming the Way We Teach Transformations." I was inspired by an article with a similar title in the August 2010 Mathematics Teacher written by Eileen Fulkenberry and Thomas Fulkenberry. (You can find the article here.)

"What Does a Grade Say?" is my session addressing a teaching practice. I will discuss Outcomes Based Grading. This is a practice that I started in my classroom in 2011 and now, as I coach, I support and help teachers implement this practice in their classrooms. It's been an interesting endeavor to put into a presentation all of the complexities regarding something that seems simple.

For those at the conference, I hope you have an opportunity to join me. Resources from the presentations can be found on the Presentations page.

#1325  Transforming the Way We Teach Transformations  10:30 - 12:00  Colony A
#1538  What Does A Grade Say  12:30 - 2:00  Meadowbrook

Sunday, October 12, 2014

Creating Curriculum Resources

I don't remember when I started developing my own resources for teaching and learning. (To be clear, I am referring to engaging learning tasks and not worksheets for practice.) It certainly wasn't when I was a beginning teacher. In my second year of teaching I was responsible for the textbook adoption at my school. What influenced my decision the most? The amount of "extras" that was included. Yes, I was impressed by the boxes of ancillary materials and the promise of consumable workbooks for each year of the adoption.

The year after the adoption, when I was using the new textbooks with all the "extras", I was introduced to a new curriculum resource Core-Plus Mathematics Project. It didn't have all of the extras. As a matter of fact, the textbook wasn't even in color unless you consider pink accents as color. The use of these materials has shaped my philosophy on teaching and learning. After years of using Core-Plus, whenever I needed a resource that was not included in the textbook, I began creating my own. It was out of necessity because those boxes of "extras" didn't provide learning tasks that assisted me in facilitating students thinking about and constructing their own understanding of the mathematics.

Fast forward 14 years. I am now a high school math coach and part of my responsibility is to assist my teachers in curriculum resources. This includes obtaining, evaluating, developing, and using the resources. One of my goals in coaching is to influence teachers to become "standards based" teachers and one strategy is using quality learning tasks. This is a challenge for a myriad of reasons of which I will not expand upon here. Suffice it to say, as a result, I find that I am writing curriculum resources.

One of my professional goals is to create curriculum resources that
  • are good, interesting, and beneficial for teaching and learning math
  • explicitly address the instructional shifts (especially for concepts that are lacking in our primary curriculum resources),
  • include instructional strategies for use with students
  • and inspire others to create learning opportunities specific to their students.
You will find these resources (and some created by my colleagues) on this site. I offer them to you to try, share, tweak, critique, and learn from. All I request in return is feedback. What worked? How can it be improved? What did students say and do? I value your input and appreciate you joining me in this important work.


Wednesday, September 17, 2014

Trouble with File Access - RESOLVED

The file links are working once again. If, in the future, they are not working, please let me know.

It has come to my attention that visitors are not able to access some of the files that I have shared. This is apparently a problem with Google Drive which is where I store all of my files. The Google Forum has posted that they are aware of the problem and are investigating.
I will be monitoring the progress. If not solved soon, I will look into other options for file sharing. If there is something you need, please comment below. I will email you the file as soon as possible.

Sunday, September 7, 2014

To Reason Quantitatively

The other day I was listening to a class discussion about independent and dependent variables. The teacher provided students with two related variables and asked students to determine which one was dependent on the other. For example, price of a ticket and number of customers.

What I observed is that few students responded. More importantly, after the discussion was over, I still had no idea which students could identify and justify which variable would be dependent and which would be independent.

The teacher and I met afterwards and planned an activity that we thought would generate more student engagement and provide information about what students really understood. The plan was to ask students to generate variables they thought were related. Next, each student would share the variables and the rest of the students would move to one side of the room or the other as to which variable they thought was the dependent variable. Students would provide their reasoning for their choice. Repeat...

So what happened? Here are some samples of what students wrote:

Hmmmm... Not what we anticipated. It appears that students identified "things" that are related but without thought about the measurement or quantities. How can we discuss independent and dependent variables when students don't recognize the quantities that are represented by the variables?

The second Standard for Mathematical Practice is to "Reason abstractly and quantitatively." What does this mean, especially to reason quantitatively? What does this mean students can do? How do we, as teachers, design experiences that increase students' ability to reason quantitatively?

 6 Principles for Quantitative Reasoning and Modeling
I recently read the article "6 Principles for Quantitative Reasoning and Modeling" by Eric Weber, Amy Ellis, Torrey Kulow, and Zekiye Ozgur (Mathematics Teacher August 2014 Vol. 108 pp. 24-30.)

The authors describe quantitative reasoning as a "specific way of thinking about mathematics" and focuses on its role in the modeling process. The first of six principles for integrating quantitative reasoning in instruction is "Rewrite a problem situation or prompt so that students must identify the quantities that they believe are relevant to solving the problem." The key idea that really stands out to me is the students identifying the quantities.

I am coaching the teacher to infuse this principle through every activity she can throughout the next module and then repeat the activity again. We agree that this must be an ongoing theme and not something a single lesson will address.

Through this experience I have become "hypersensitive" to whether students are reasoning quantitatively and if teachers are providing opportunities for students to develop this habit of thinking about mathematics. So, when a teacher asks me for advice on a lesson plan or an activity this is one of lenses I am using.

How do you address this mathematical practice? Share your experiences and strategies.